Simplifying stock analysis data
Simplifying stock, ETF, and crypto details in a B2C investing app to reduce cognitive load.
Case Study
Tides Network
Introduction
RAFA is an AI-driven B2C mobile app that helps experienced investors track their portfolios and define their next moves. I joined as the Product Designer for the beta and later versions following alpha, working with a team of two engineers and a UX researcher, and in close conversation with the Head of AI, CTO, and CEO.
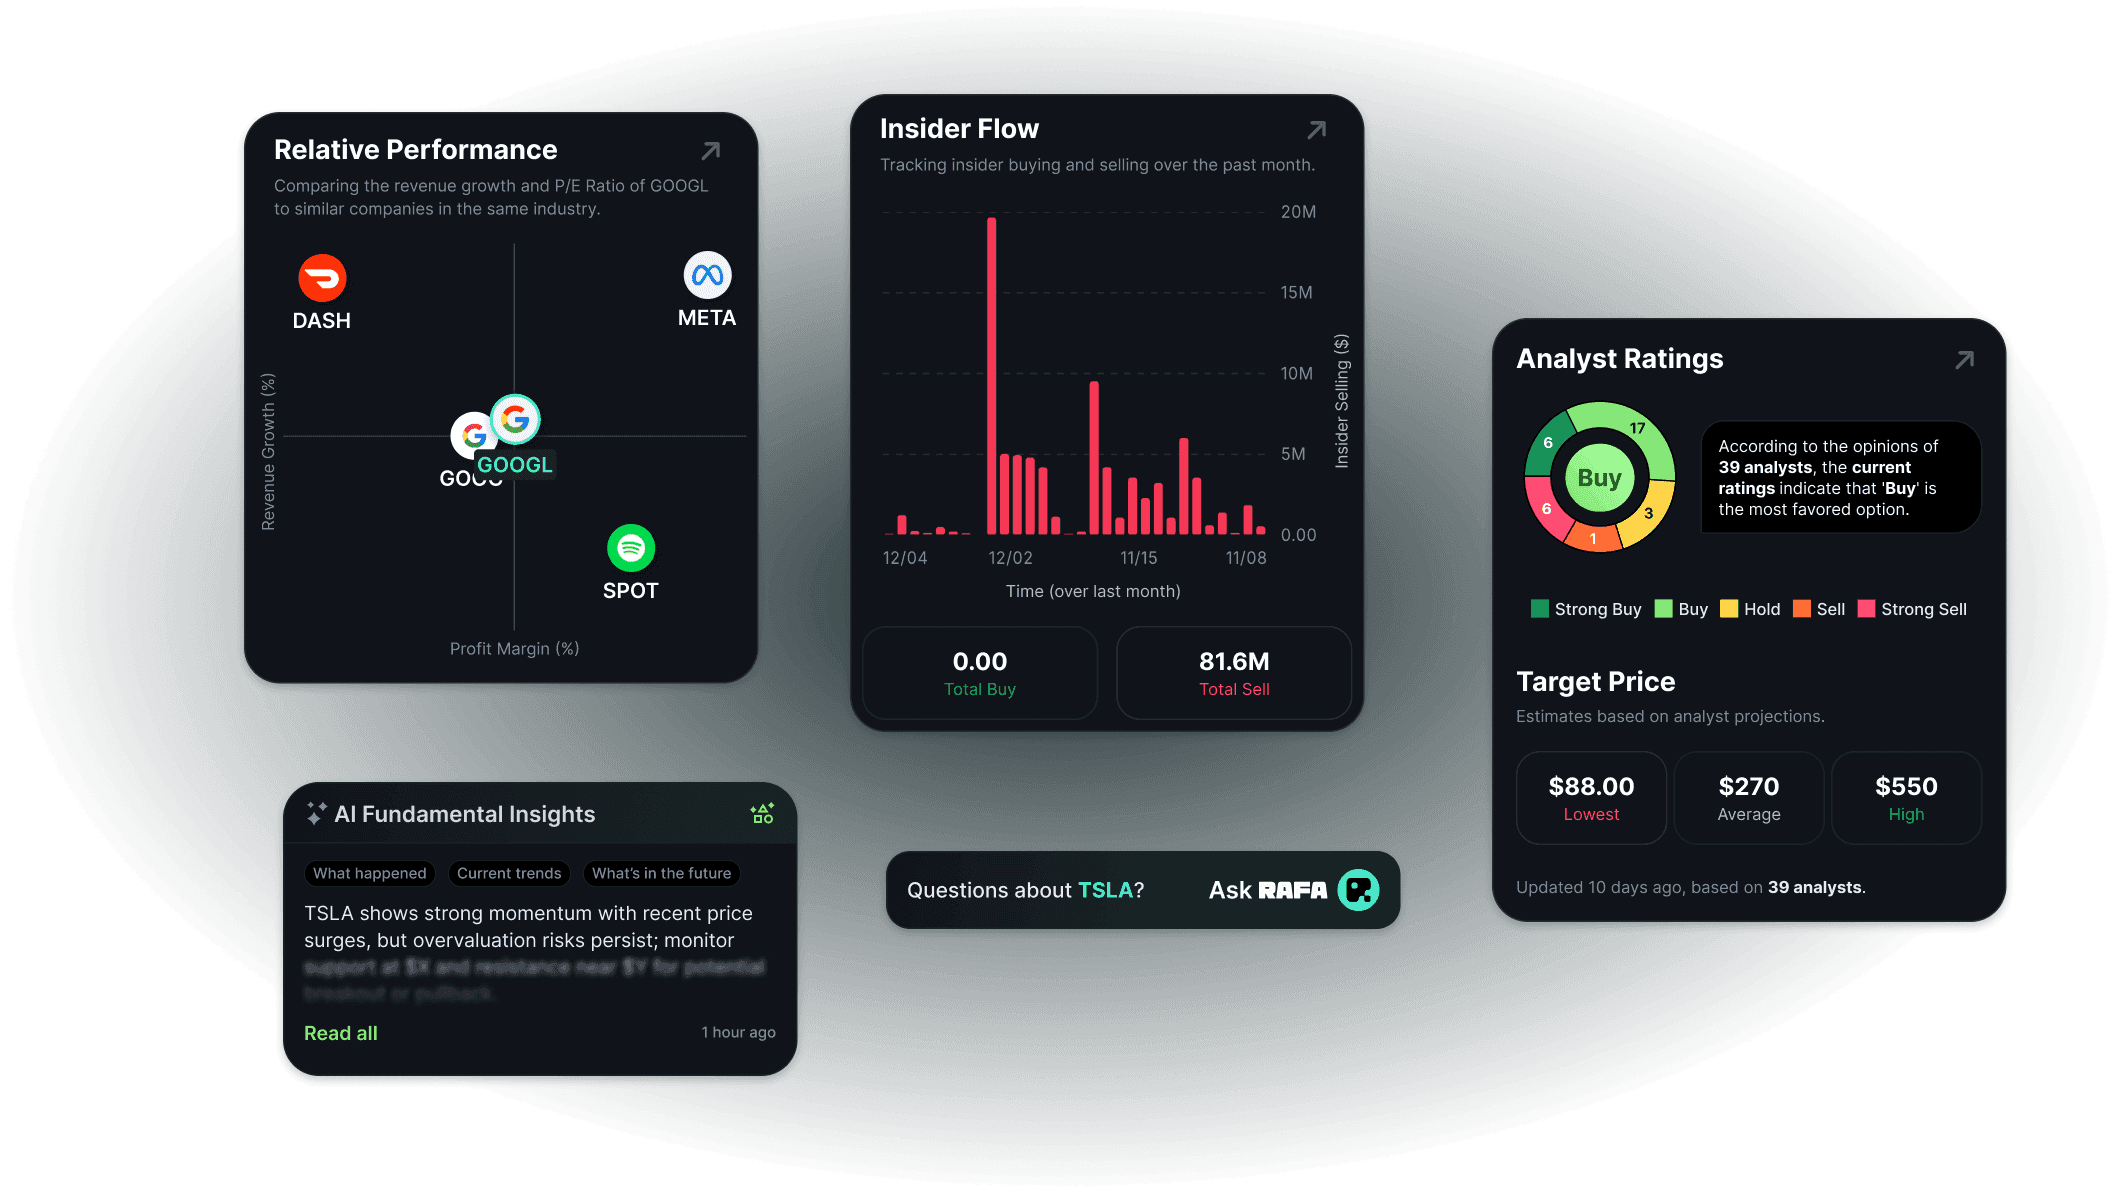
In this case study, I'll talk about the process of designing one of RAFA's main features: Ticker Pages, and how I managed to simplify valuable AI insights and data on stocks, ETFs, and crypto to avoid cognitive overload.
What we needed
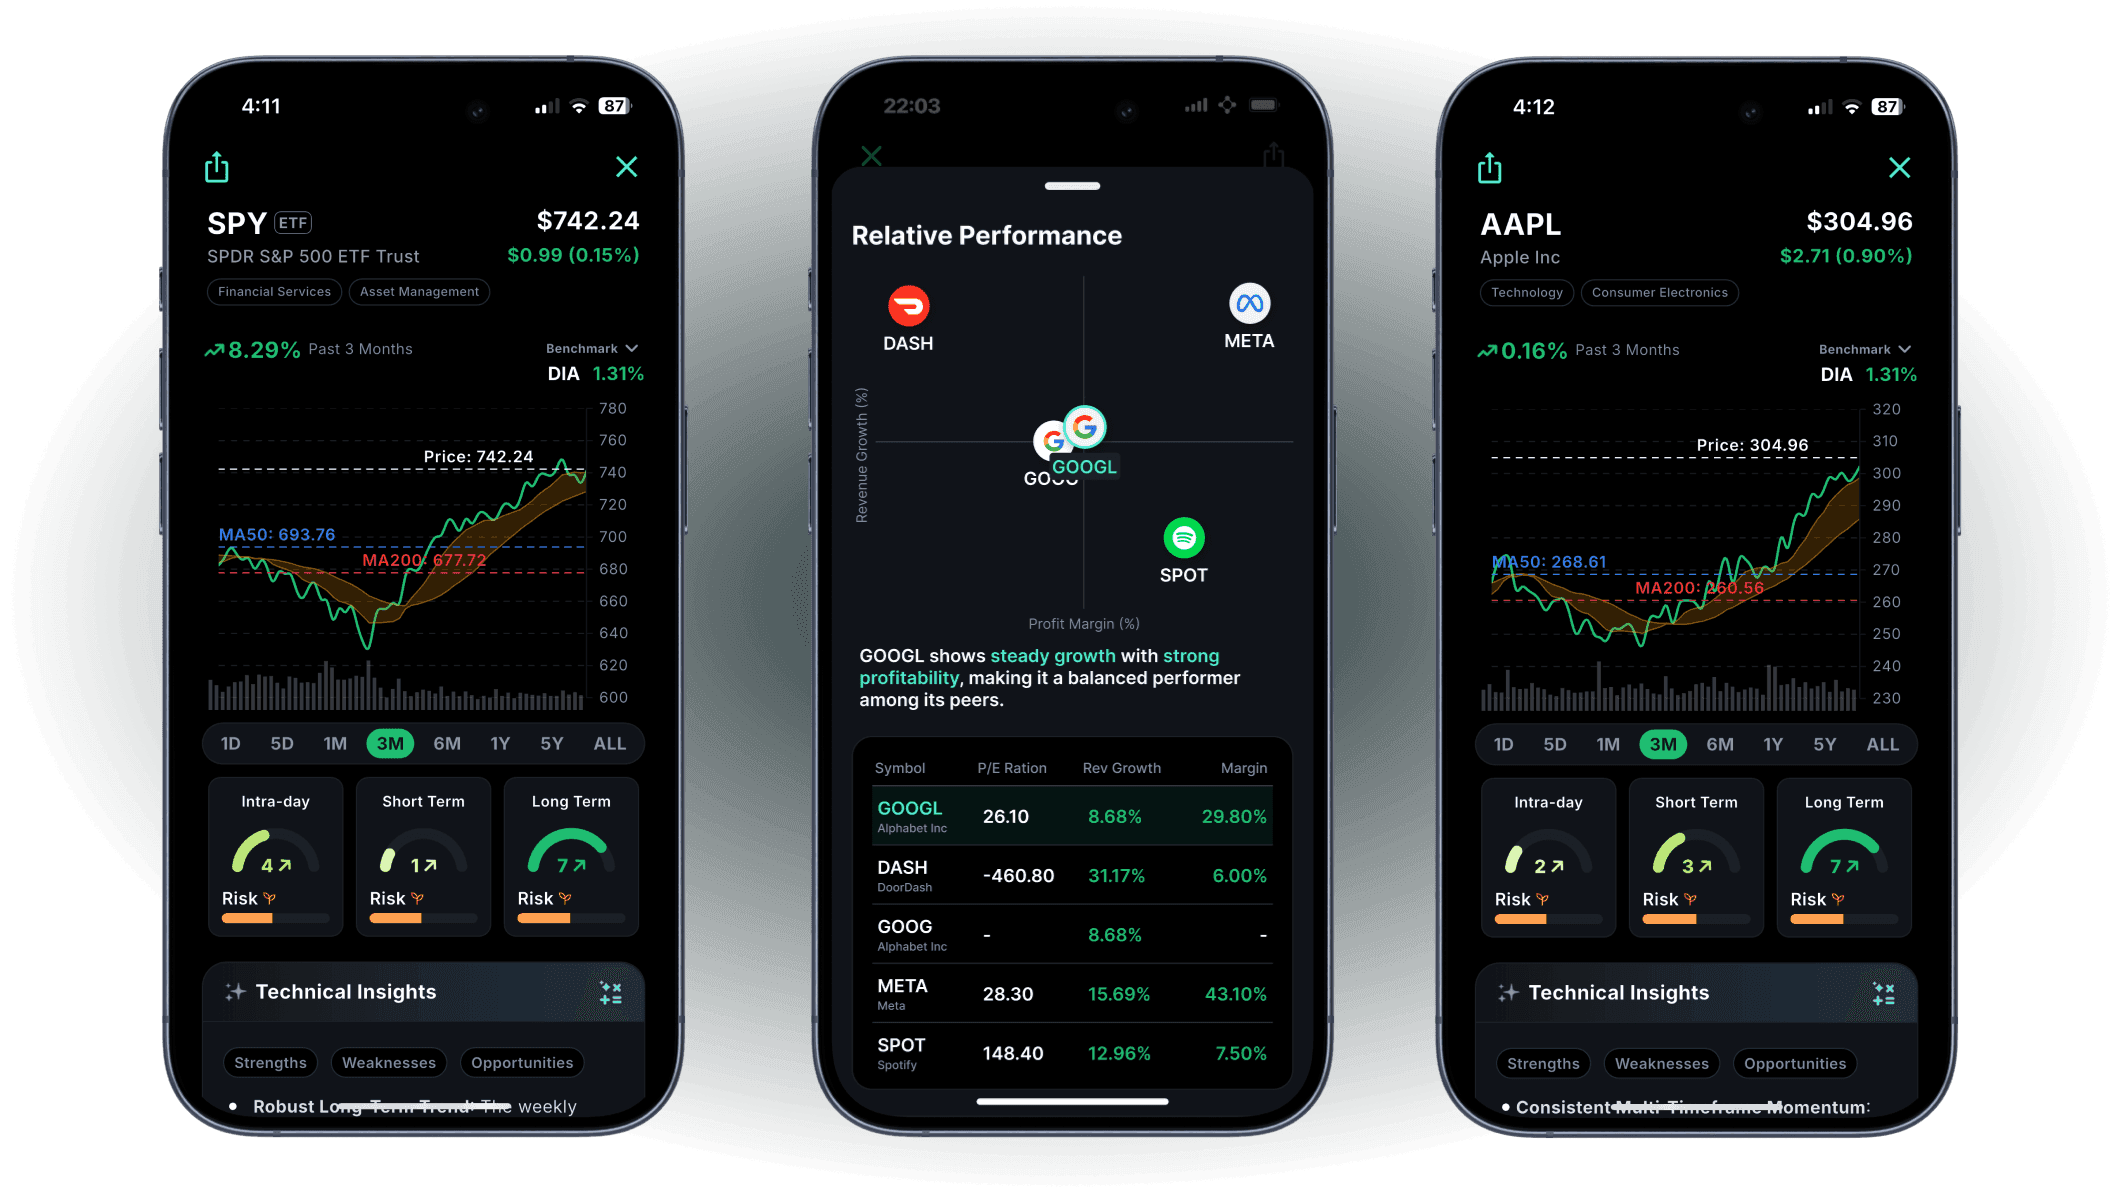
Ticker Pages are basically the detail page for every Stock, ETF an Crypto in the U.S. market, which means thousands of possibilities. Designing one for each would be an impossible, and frankly insane, idea. I needed to create a design that could adapt to:
Each ticker type. For example, the detail page of an ETF would need to show its composition, while a crypto or a stock would not.
AI-generated analysis that could or could not be available, and could vary in length and topics.
Very long and very short content cases.
Overwhelming amounts of information that needed to be simplified but, for our target users, shouldn't be watered down.
The Solution
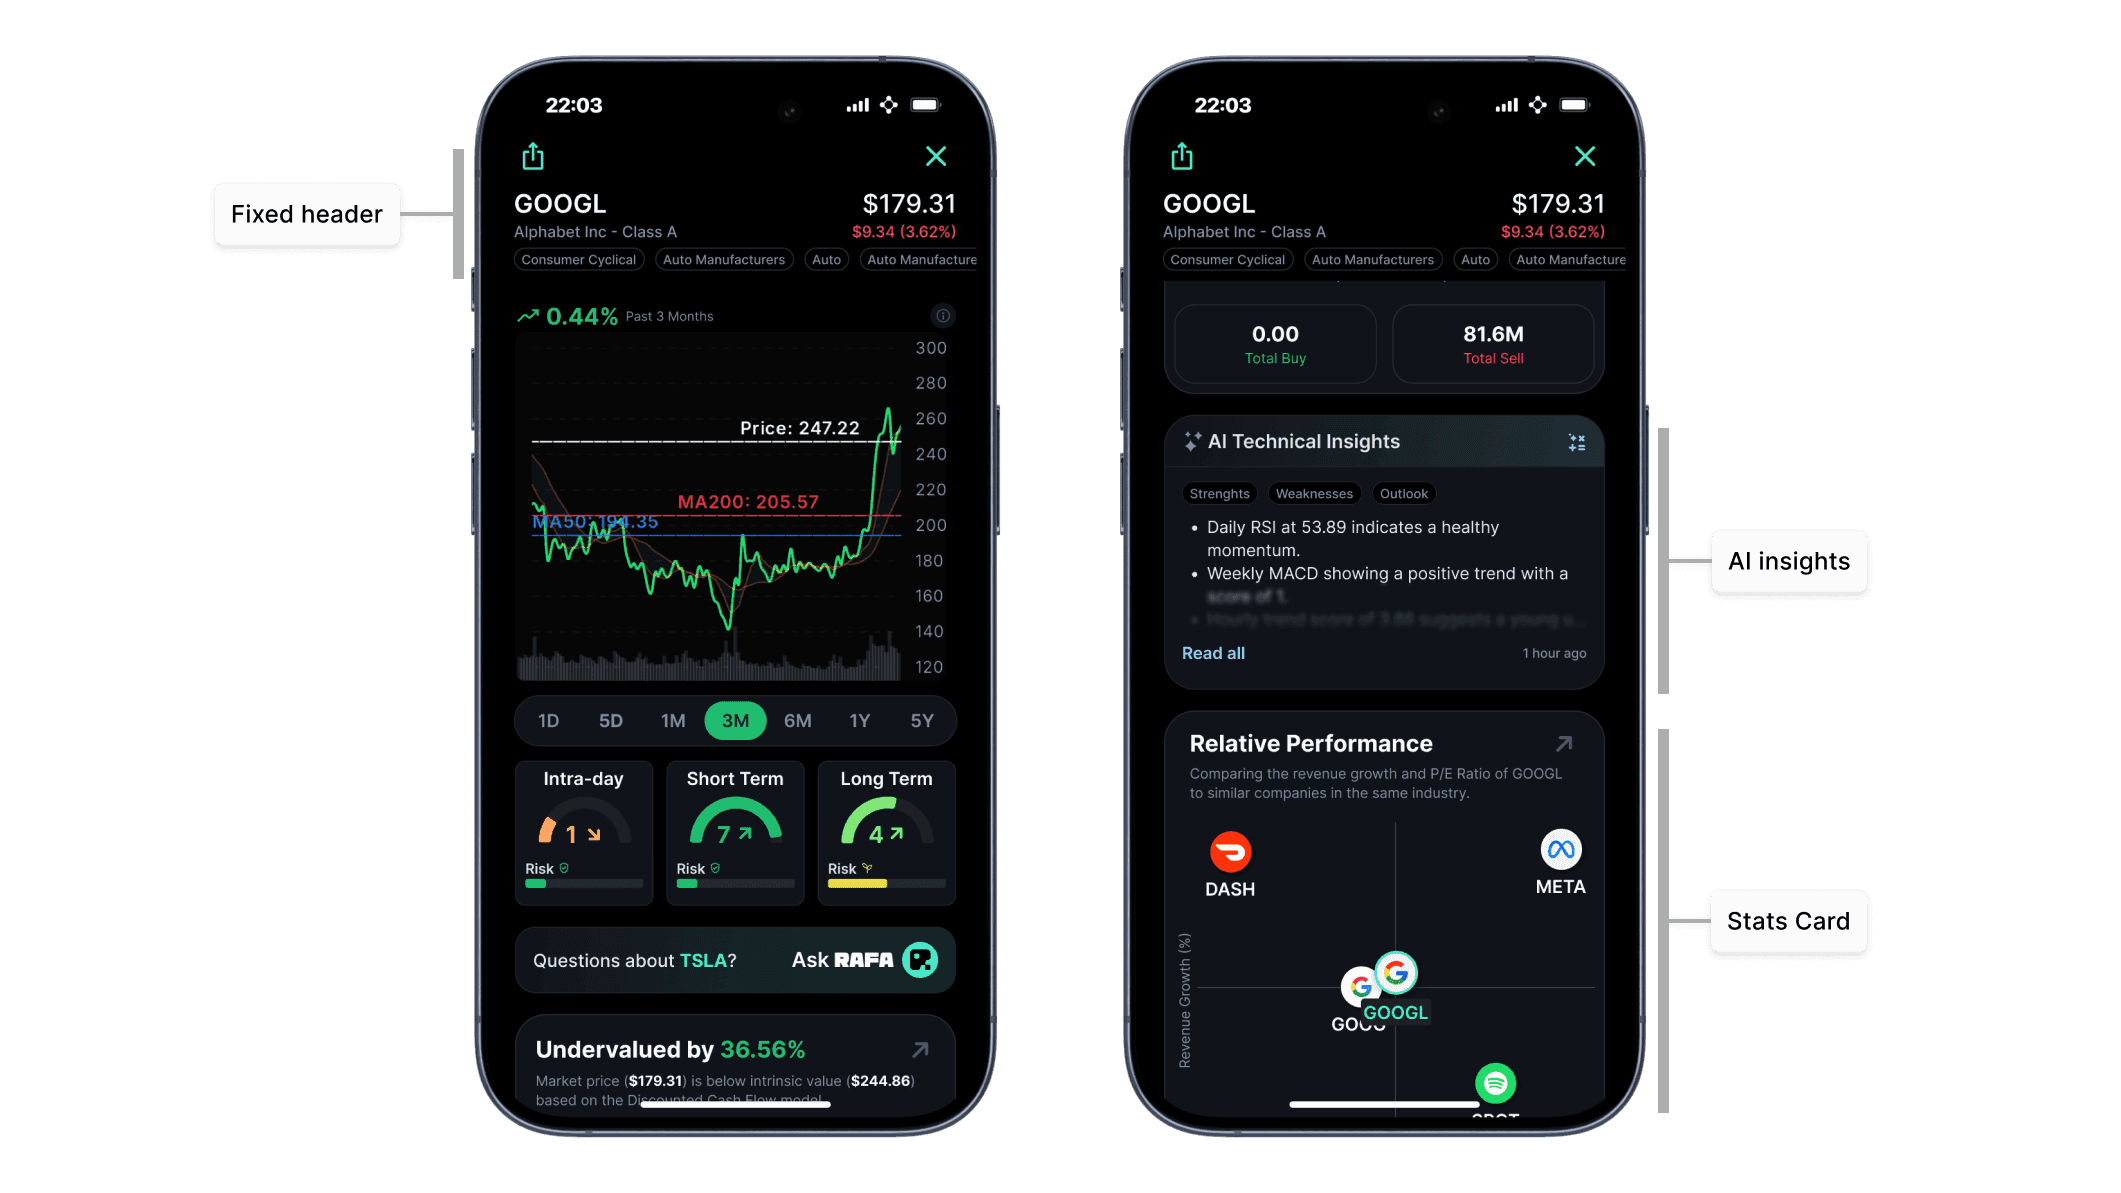
First, I established a flexible layout that could adapt to the diverse cases. I built the page design with modular cards. Each card would display specific data, and on tap would open a drawer with more information for those interested.
AI Insight Cards: Dedicated to specific insights from the agents, could be Technical, Fundamental or News Insights.
Stats Cards: Give key information about performance and market context.
Alongside the stakeholders, we defined the content we wanted to cover with each Stat Card, and these would work as puzzle pieces for the different tickers.
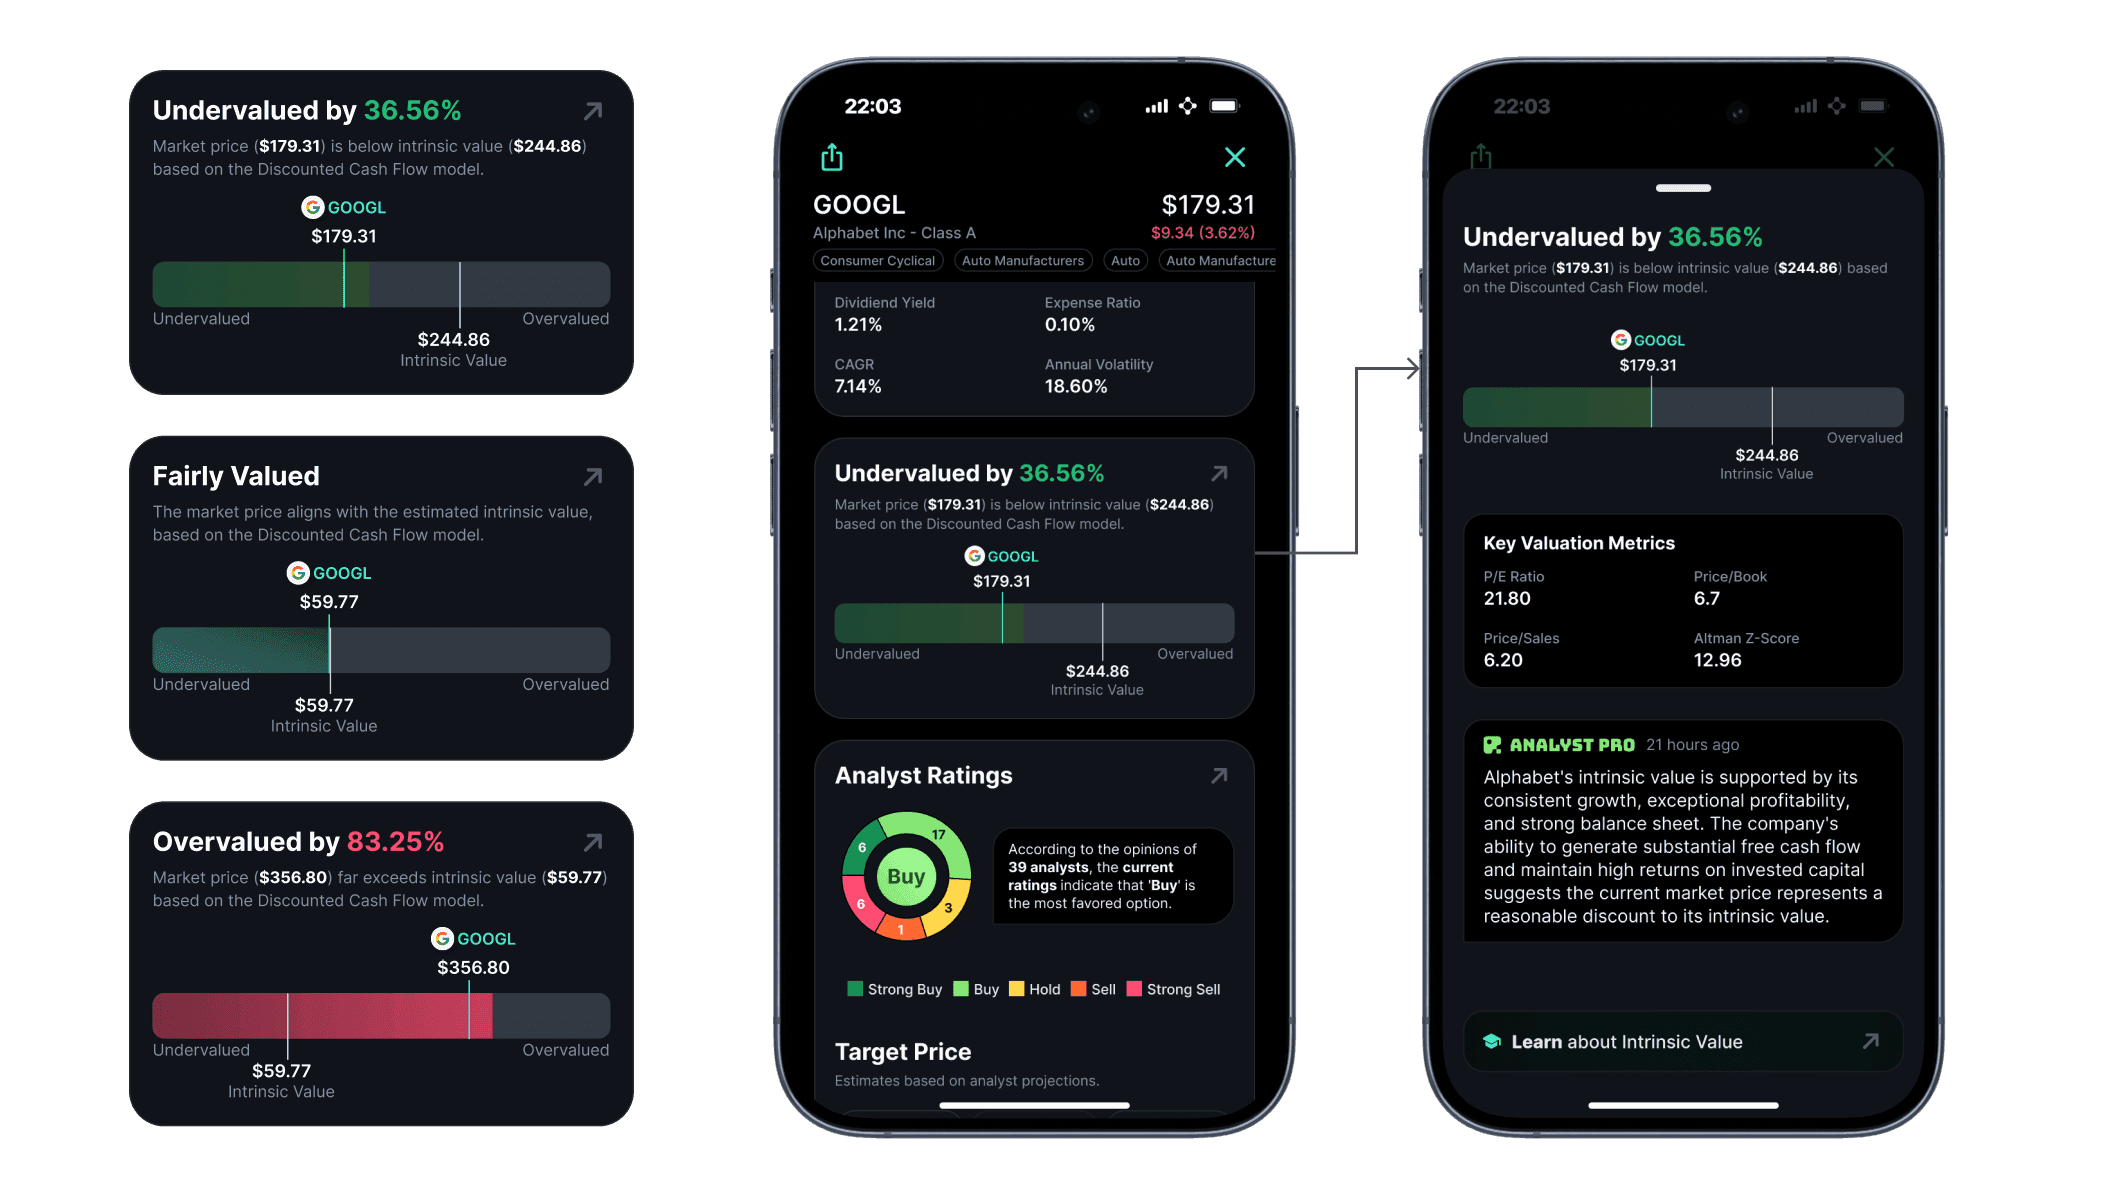
One example is the Intrinsic Value Card, which uses the Discounted Cash Flow (DCF) model to help determine if a ticker is overvalued or undervalued. The design compares the intrinsic value calculated by the DCF model with the current market value.
Results
This project was part of RAFA's V1 public release. We tracked interaction data to understand usage patterns, and the Ticker Analysis page quickly became the most visited feature. Users spent about 80% of their in-app time there.
These early results validated the design direction and led to the next challenge: analyzing how users engaged with AI-driven conversations to uncover patterns in their investment behavior and keep improving the experience.